Measurement of the Photon Beam Asymmetry in $\vec{\gamma} p\to K^+\Sigma^0$ at $E_{\gamma} = 8.5$ GeV
Abstract:
We report measurements of the photon beam asymmetry $\Sigma$ for the reaction $\vec{\gamma} p\to K^+\Sigma^0$(1193) using the GlueX spectrometer in Hall D at Jefferson Lab. Data were collected using a linearly polarized photon beam in the energy range of 8.2-8.8\,GeV incident on a liquid hydrogen target. The beam asymmetry $\Sigma$ was measured as a function of the Mandelstam variable $t$, and a single value of $\Sigma$ was extracted for events produced in the $u$-channel. These are the first exclusive measurements of the photon beam asymmetry $\Sigma$ for the reaction in this energy range. For the $t$-channel, the measured beam asymmetry is close to unity over the $t$-range studied, $-t=(0.1-1.4) $(GeV/$c$)$^{2}$, with an average value of $\Sigma$ = 1.00 $\pm$ 0.05. This agrees with theoretical models that describe the reaction via the natural-parity exchange of the $K^{*}$(892) Regge trajectory. A value of $\Sigma$ = 0.41 $\pm $0.09 is obtained for the $u$-channel integrated up to $-u=2.0$ (GeV/$c$)$^{2}$.Journal: Phys. Rev. C101, 065206 (2020)
arXiv: arXiv:2003.08038
HEPdata: link
PRC 101, 065206: downloads png pdf |
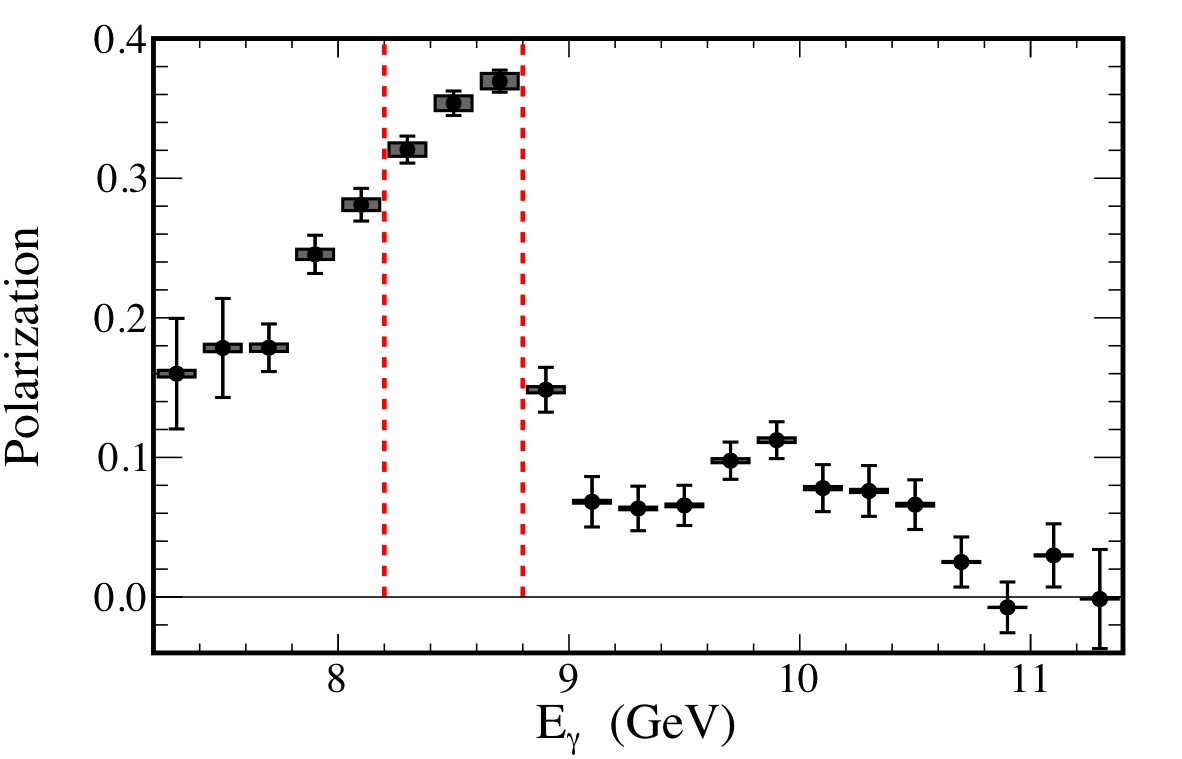
Figure 1:
Photon beam polarization as a function of beam energy, as measured by the triplet polarimeter, averaged over the four different diamond orientations. Dashed vertical lines indicate the beam energy range used for this analysis. Vertical error bars show the statistical uncertainty and inner shaded regions show the systematic uncertainty due to the 1.5% relative uncertainty from the polarimeter analyzing power. The polarizations for the individual orientations are presented in Ref. [21]. |
PRC 101, 065206: downloads png pdf |
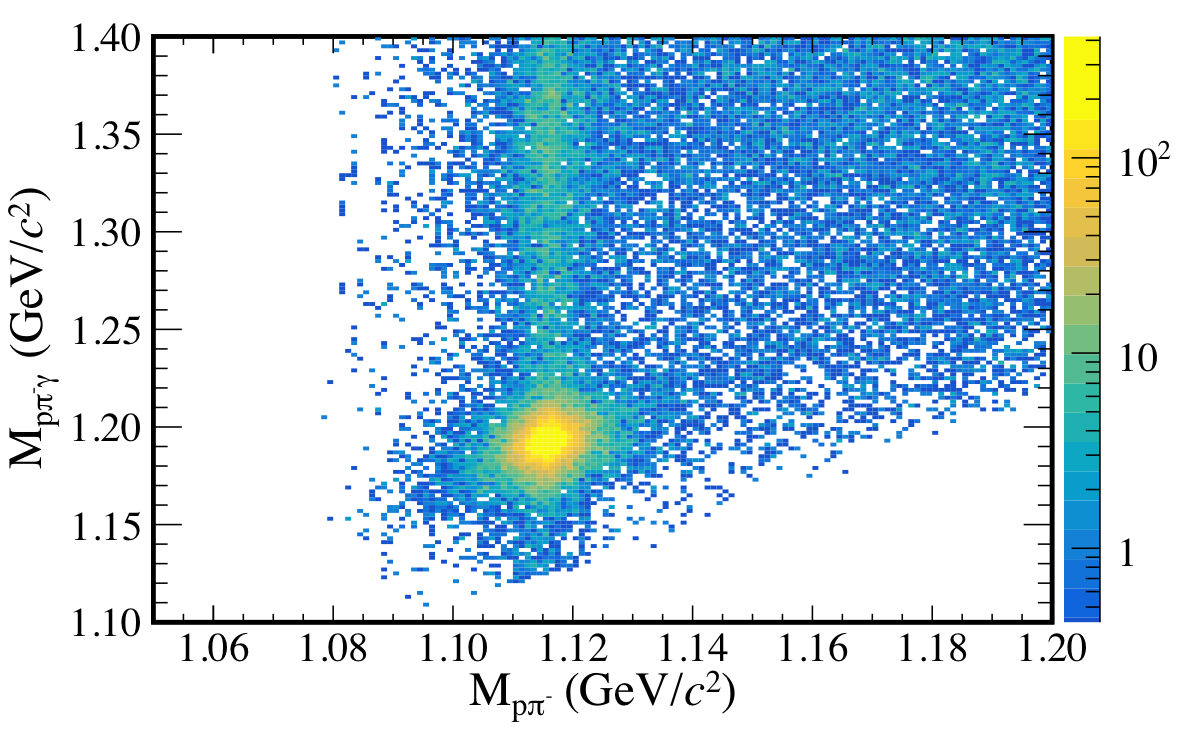
Figure 2:
Invariant mass of $p\pi^{-}\gamma$ vs. invariant mass of $p\pi^{-}$ after all cuts. The enhancement in the overlap region corresponds to the $\Lambda^0(1116)$ and $\Sigma^{0}(1193)$. |
PRC 101, 065206: downloads png pdf |
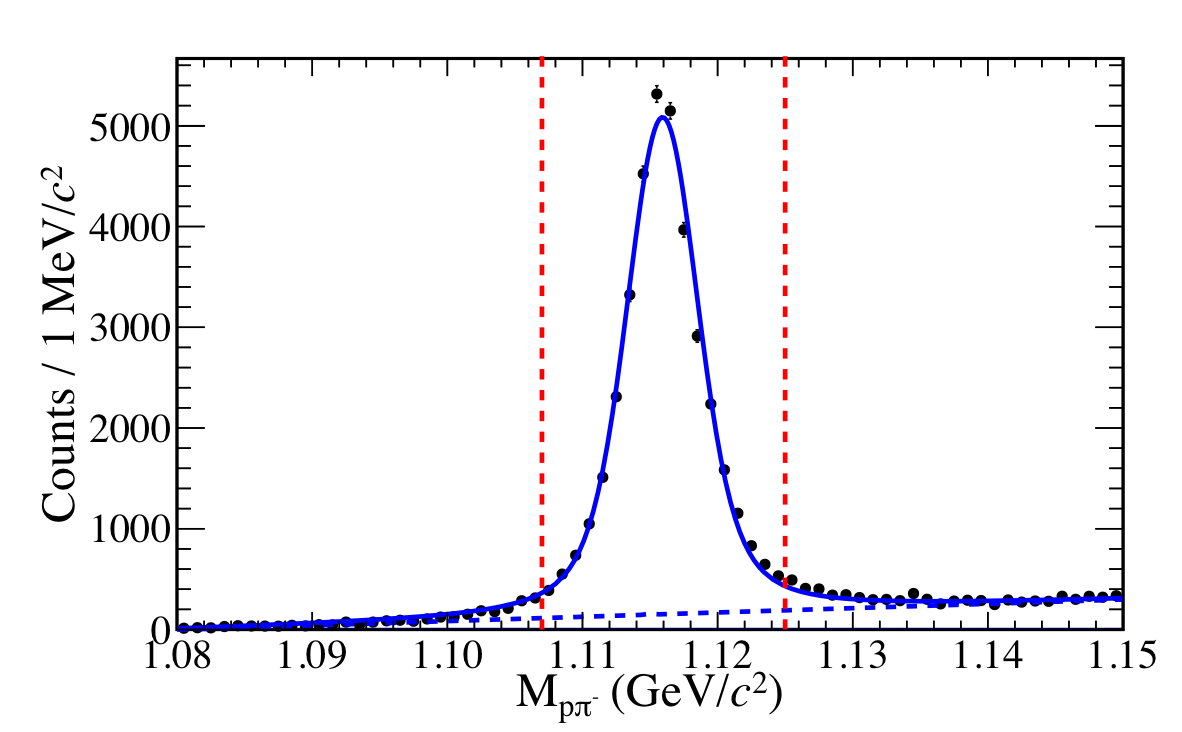
Figure 3:
Invariant mass of $p\pi^{-}$ (solid circles). The solid curve is the sum of a Voigtian and a first order Chebyshev polynomial (dashed curve) fitted to the data. The selection region of $\Lambda$ signal events is indicated by the vertical dashed lines. |
PRC 101, 065206: downloads png pdf |
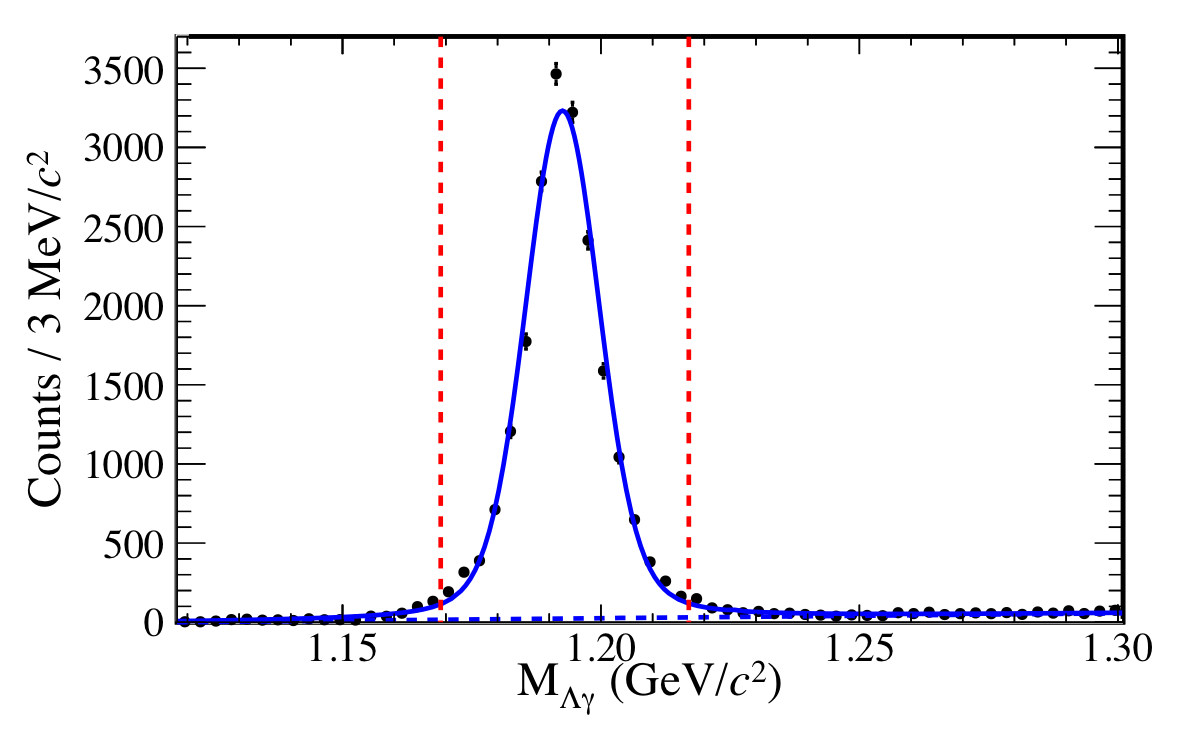
Figure 4:
The invariant mass of $\Lambda\gamma$ (solid circles). The solid curve is the sum of a Voigtian and a first order Chebyshev polynomial (dashed curve) fitted to the data. The selection region of $\Sigma^0$ events for further analysis is indicated by the vertical dashed lines. |

PRC 101, 065206: downloads png pdf |
Figure 5a:
Event yields for $\vec{\gamma} p\to K^+\Sigma^{0}$ (solid circles) and detector acceptance (dashed lines), (a) as a function of $-t$ and (b) as a function of $-u$. |
PRC 101, 065206: downloads png pdf |
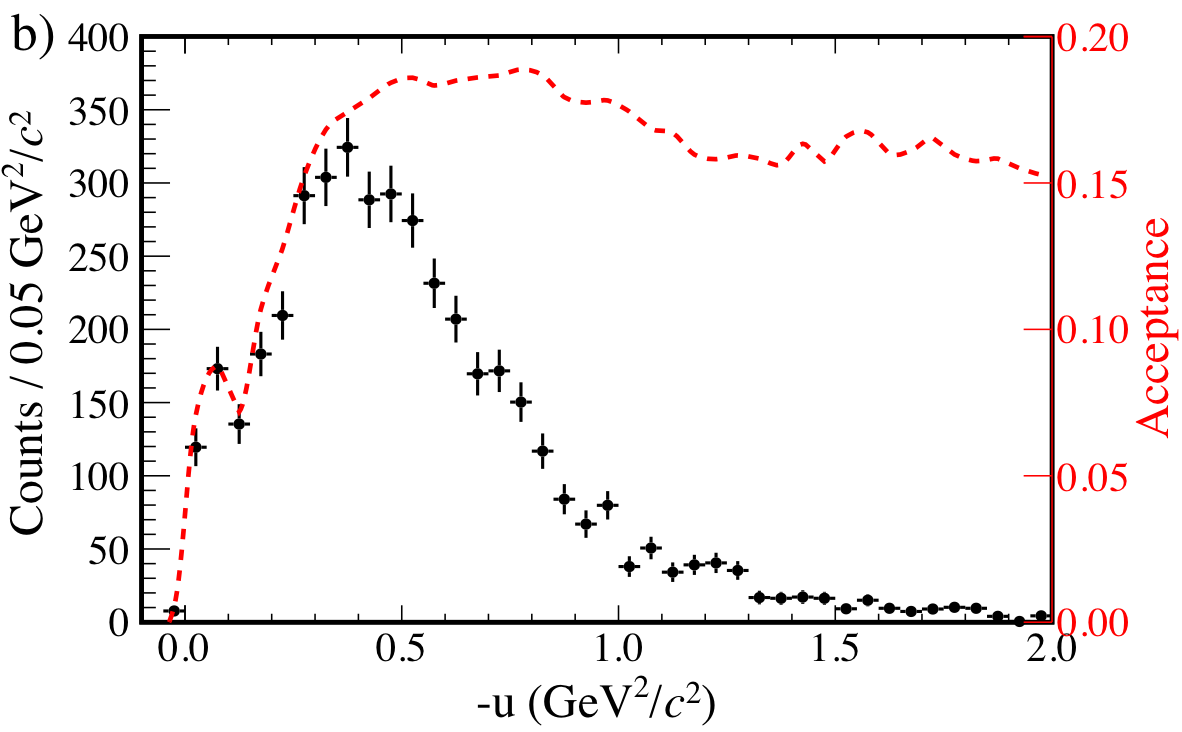
Figure 5b:
Event yields for $\vec{\gamma} p\to K^+\Sigma^{0}$ (solid circles) and detector acceptance (dashed lines), (a) as a function of $-t$ and (b) as a function of $-u$. |
PRC 101, 065206: downloads png pdf |
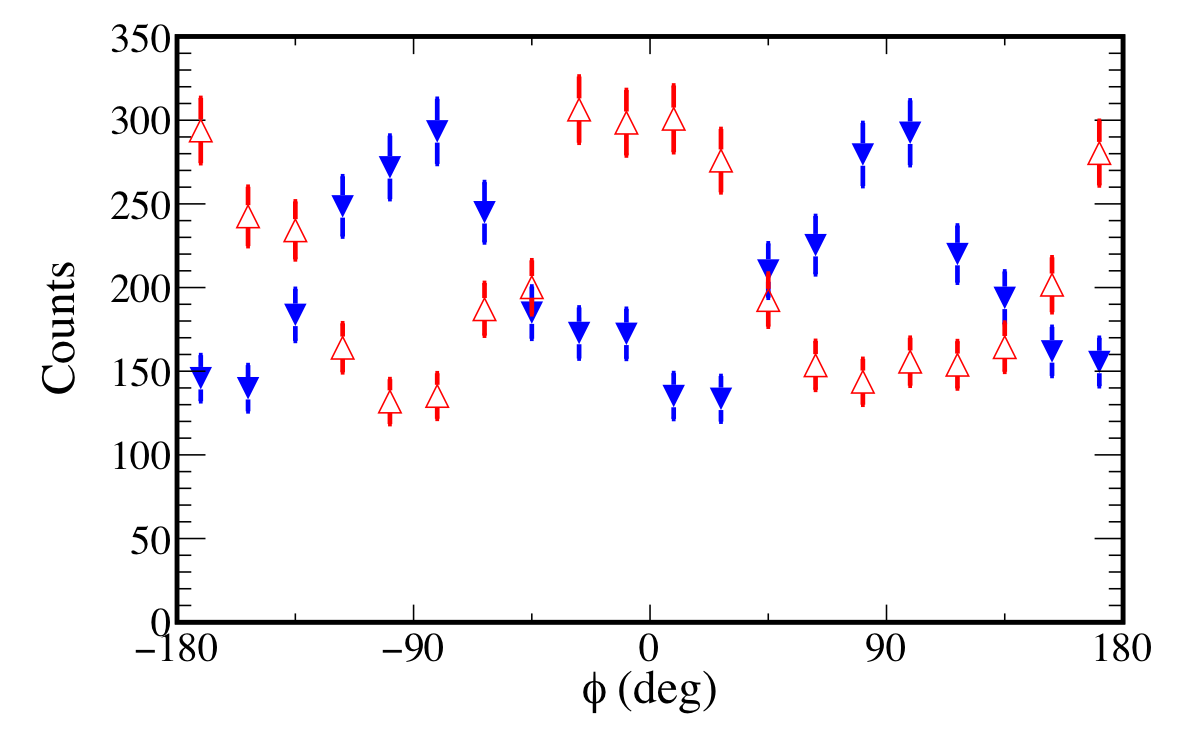
Figure 6:
Yield of $\vec{\gamma} p\to K^{+}\Sigma^{0}$ events versus $\phi$ integrated over $t$ for the $90^{\circ}$ (open upward triangles) and $0^{\circ}$ (closed downward triangles) polarization orientations. |
PRC 101, 065206: downloads png pdf |
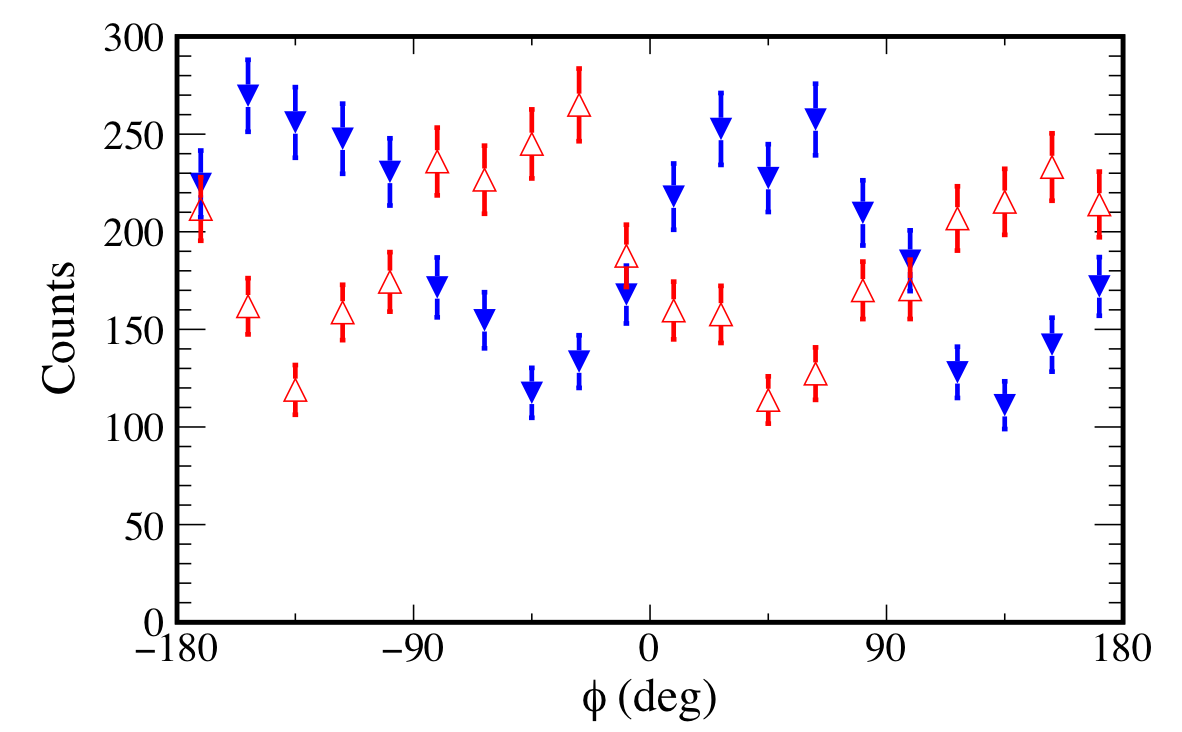
Figure 7:
Yield of $\vec{\gamma} p\to K^{+}\Sigma^{0}$ events versus $\phi$ integrated over $t$ for the $45^{\circ}$ (open upward triangles) and $-45^{\circ}$ (closed downward triangles) polarization orientations. |
PRC 101, 065206: downloads png pdf |
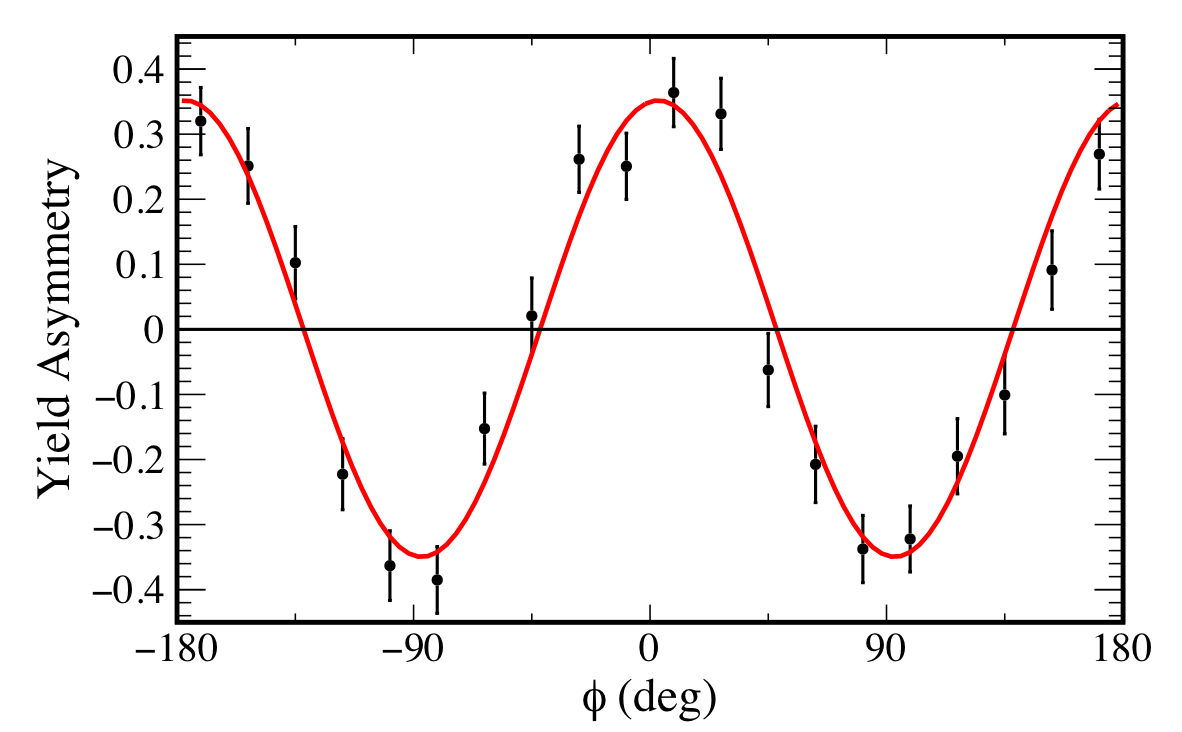
Figure 8:
The yield asymmetry for the 0/90 orientation set, corresponding to the data in Fig. 6 with a fit of Eq. 9 (solid curve). See text for details. |
PRC 101, 065206: downloads png pdf |
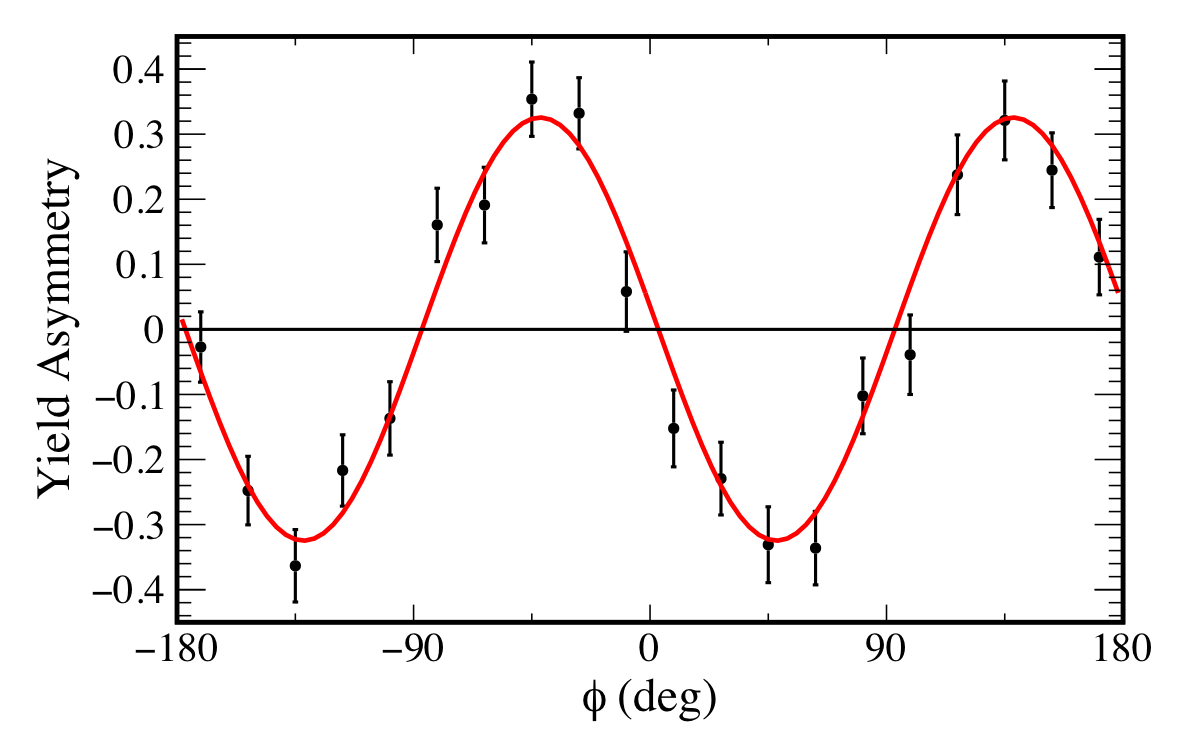
Figure 9:
The yield asymmetry for the -45/45 orientation set, corresponding to the data in Fig. 6 with a fit of Eq. 9 (solid curve). See text for details. |
PRC 101, 065206: downloads png pdf |
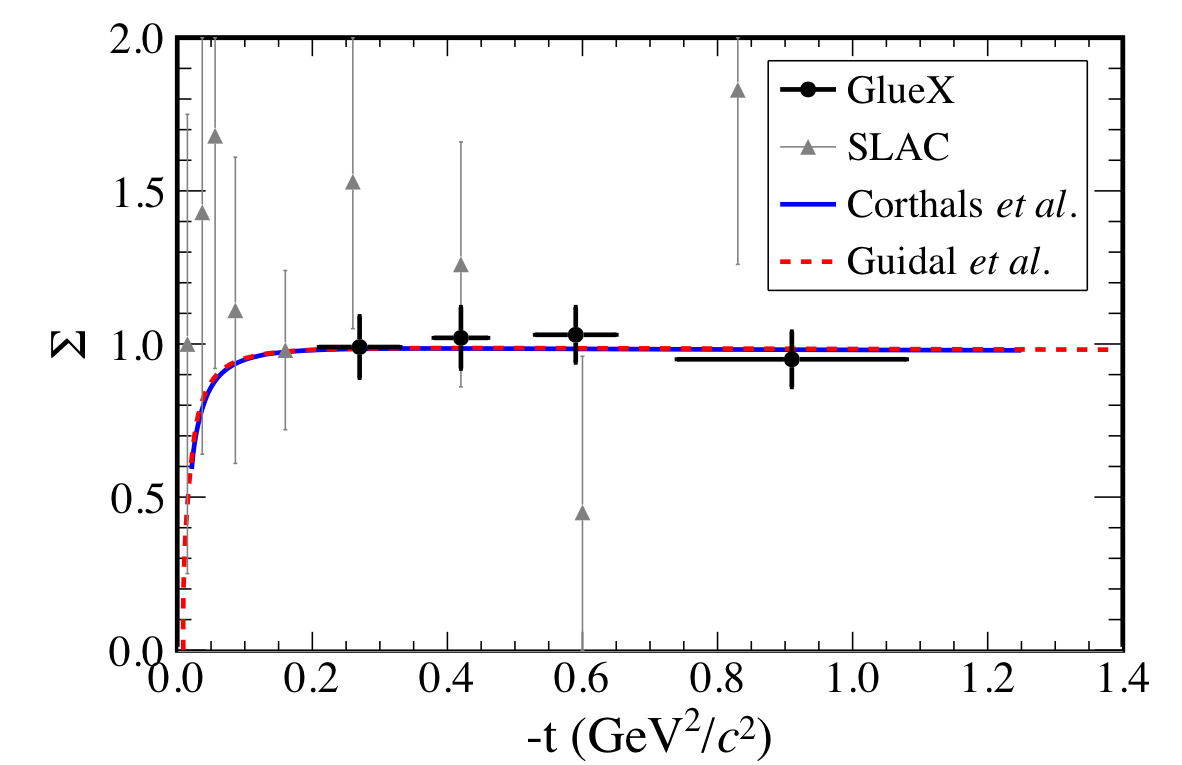
Figure 10:
The beam asymmetry $\Sigma$ for $\vec{\gamma} p\to K^+\Sigma^0$ as a function of $-t$. The results from the 0/90 and -45/45 data sets are averaged (solid circles) where horizontal error bars indicate the RMS widths of the $t$ bins and vertical error bars represent statistical and systematic uncertainties added in quadrature. An additional 2.1% overall relative polarization uncertainty is not included. The triangles are previous SLAC results [2] at $E_{\gamma} = 16$ GeV, the curves show predictions from RPR-2007 [6,7] (solid) and Guidal et al. [5] (dashed) at $E_{\gamma} = 8.5$ GeV. |